Civic Tech, Full-Stack Development, Urban Planning, Public Participation
Public engagement in planning practices takes time and effort to plan. Especially in small and medium sized firms, time is money and finding efficient ways to gather public opinion is invaluable. I wanted to find ways to eliminate the boring and costly parts of public engagement efforts such as logging attendee details, using third party survey apps, consolidating all kinds of data into a digital format, etc. Often, Planners arrive at community sessions with paper sign-in sheets, printed or emailed surveys, and no way to collect digitized spatial opinions from residents in real time. Data gets lost, transcribed incorrectly, or never analyzed at all. This portal is a purpose-built digital tool that replaces that entire workflow from attendee registration to map-based community input, putting structured, exportable data in the planner’s hands by the end of the session.
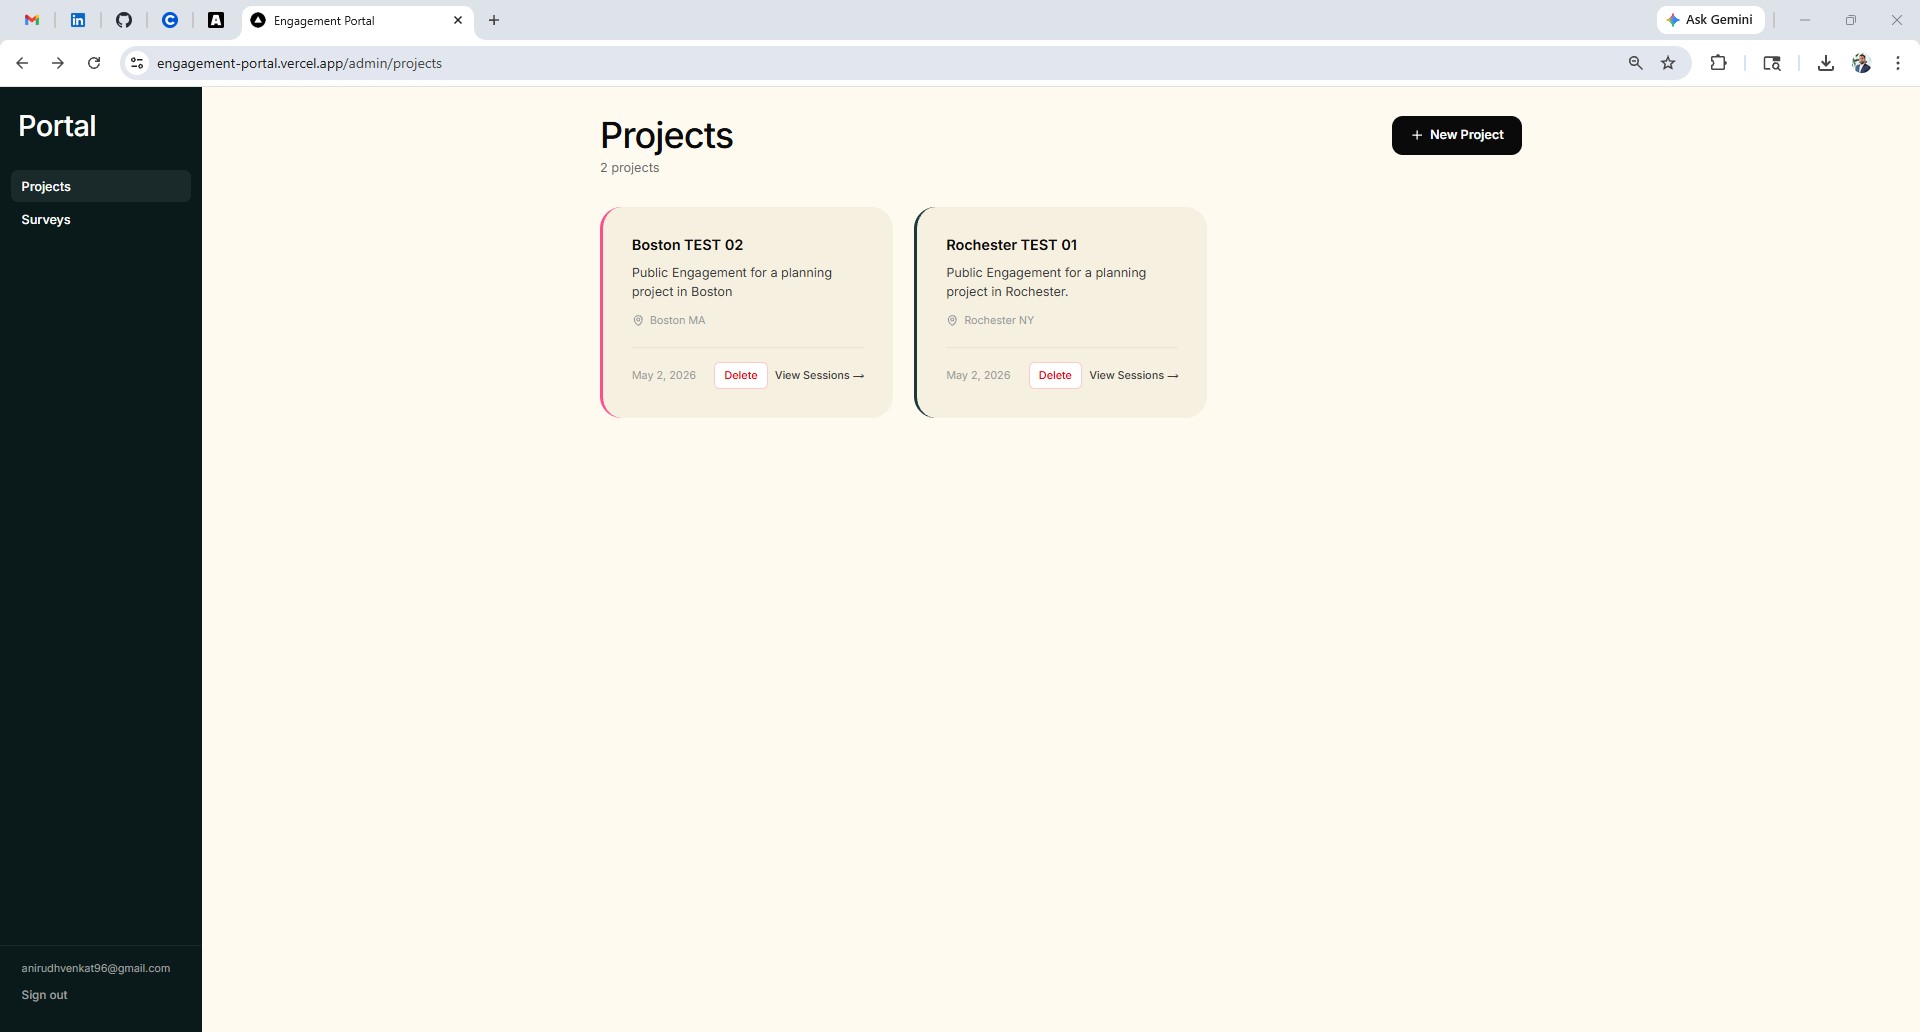
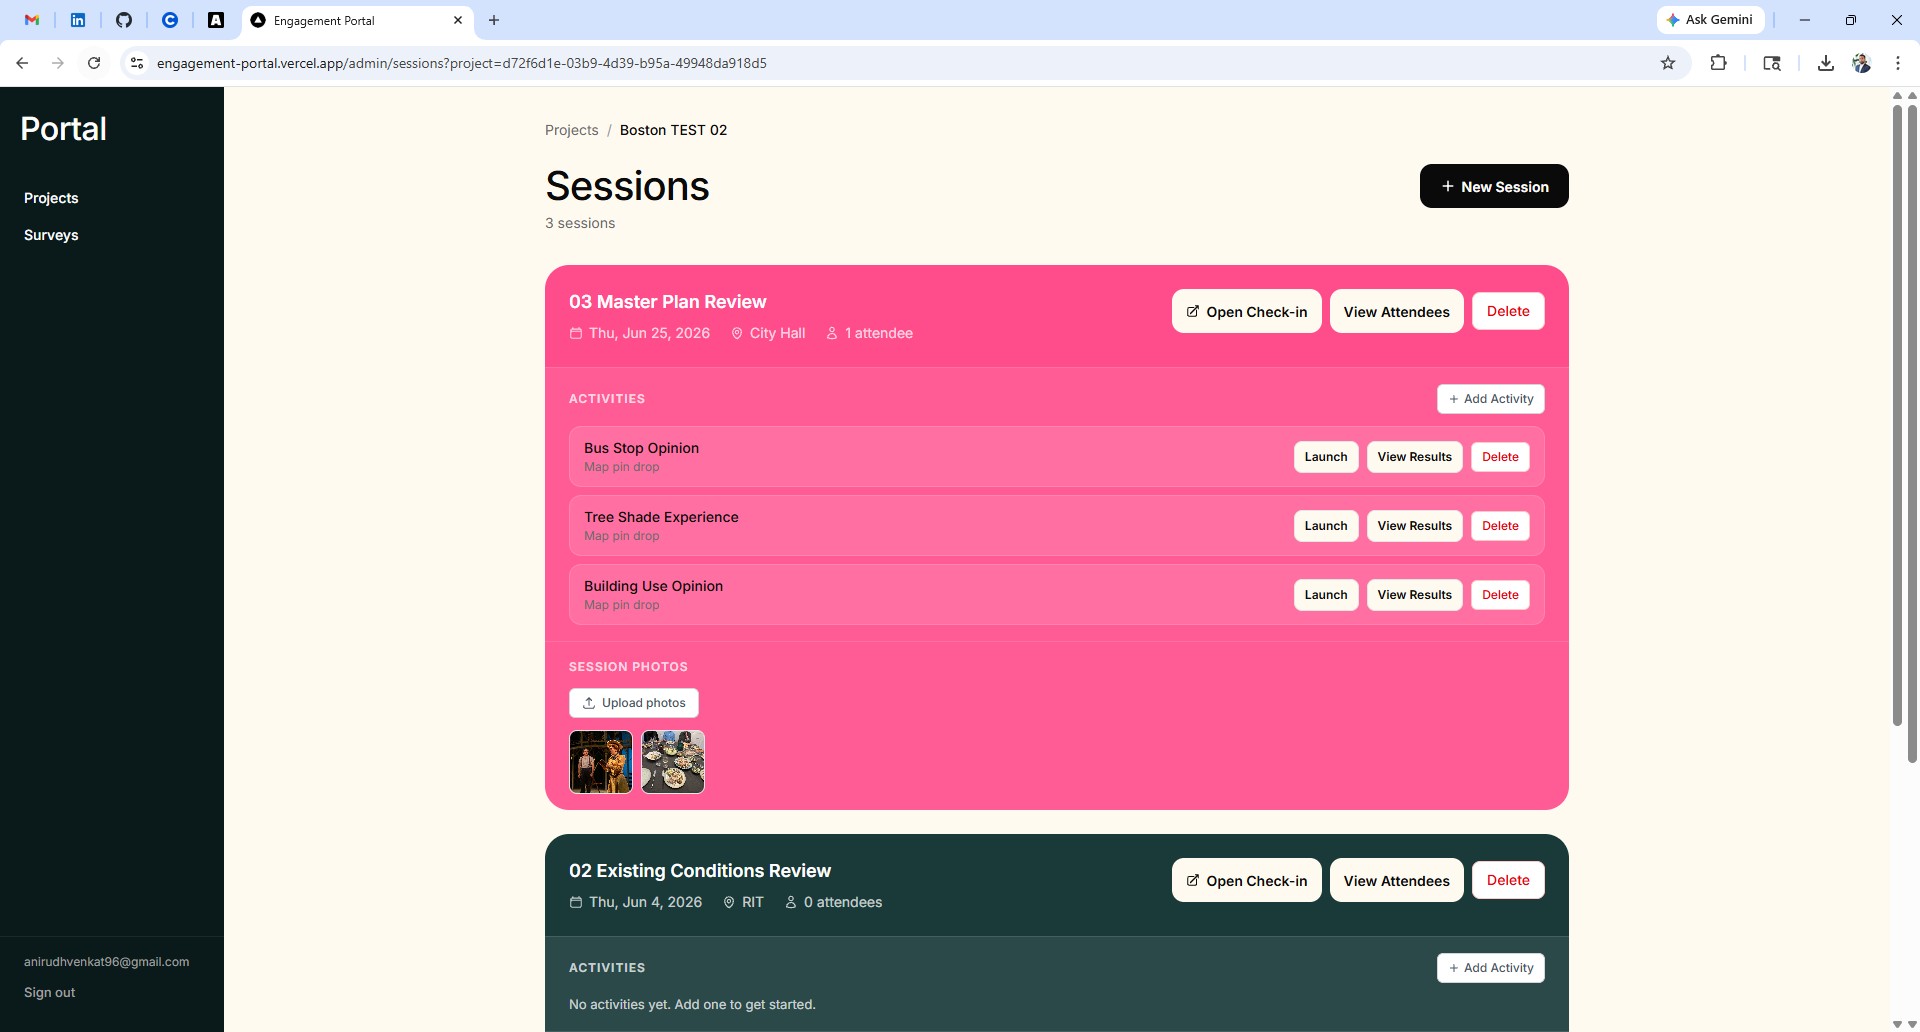
Before an engagement day, the planner creates a project and sets up a session in the admin dashboard. Each session lives under a project, can hold multiple engagement activities, and has its own photo folder for documentation.
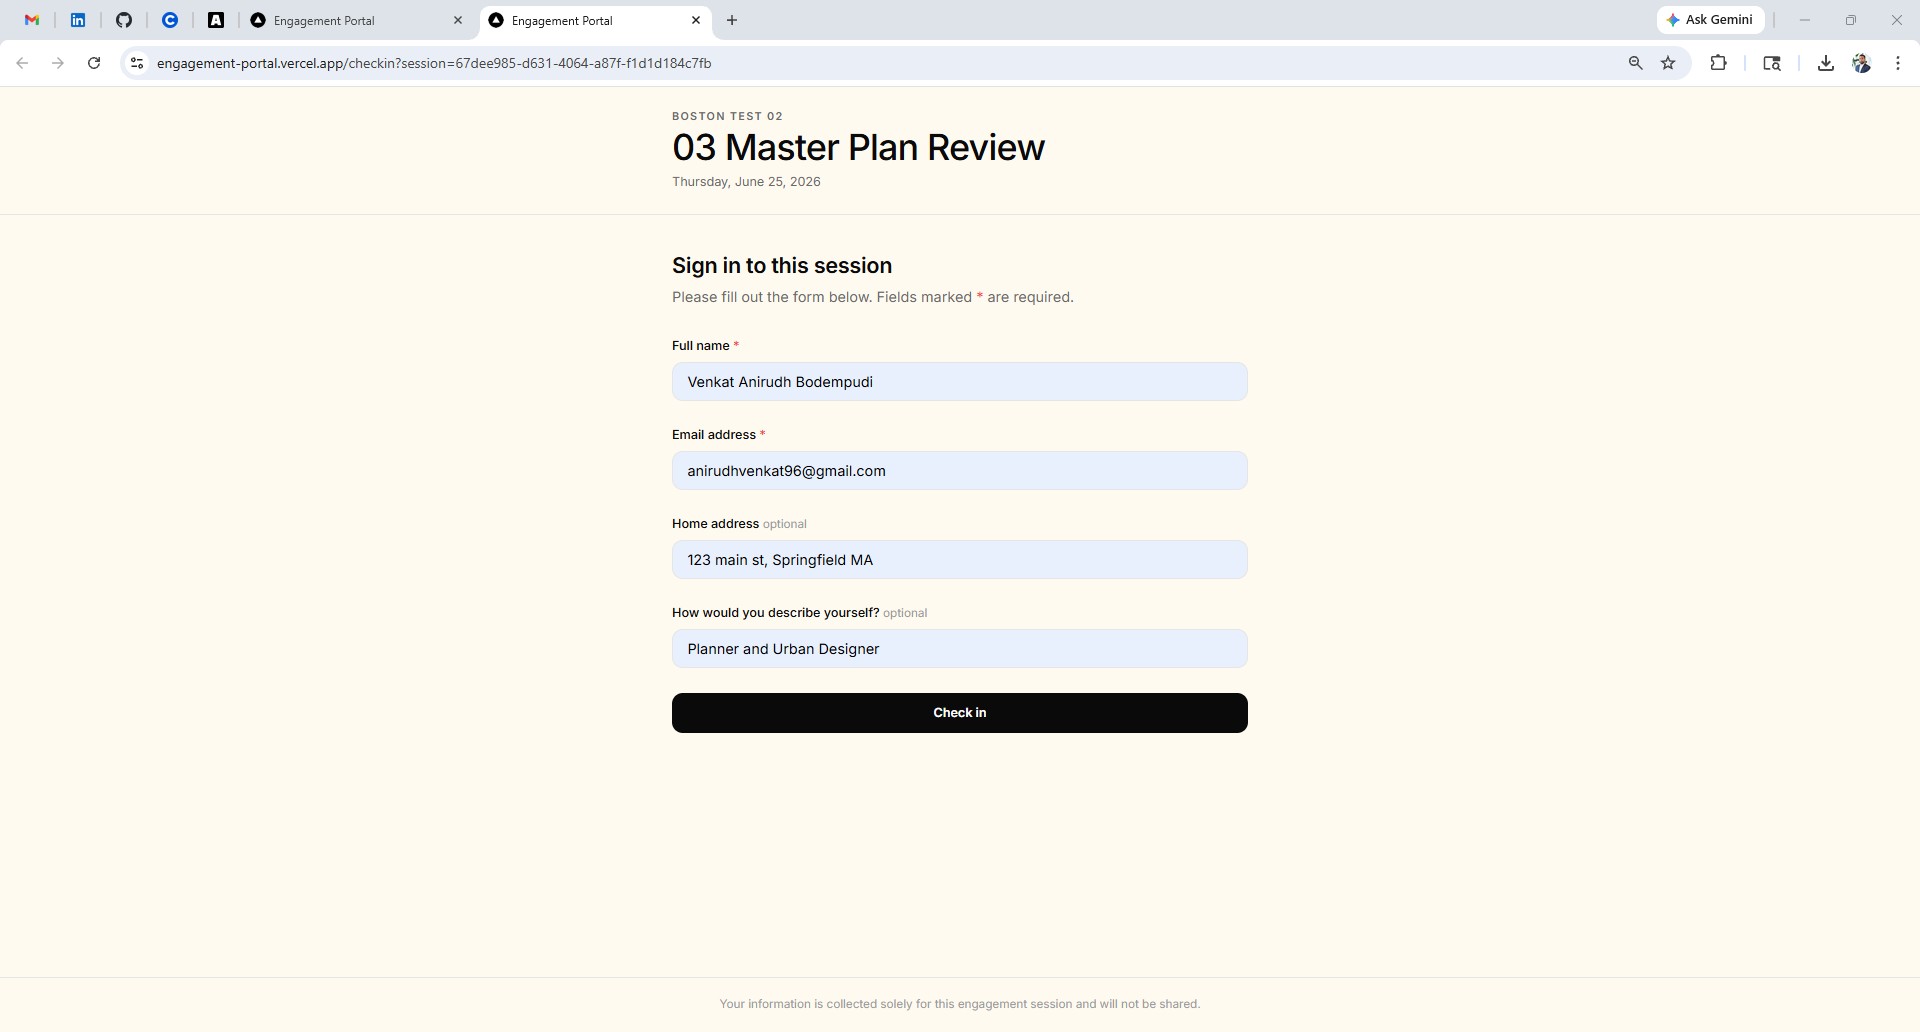
When community members arrive at the venue, they are handed a tablet or laptop with the check-in screen open. They enter their name, email, address, and neighborhood affiliation. Every submission is automatically linked to the session — no paper, no manual transcription.
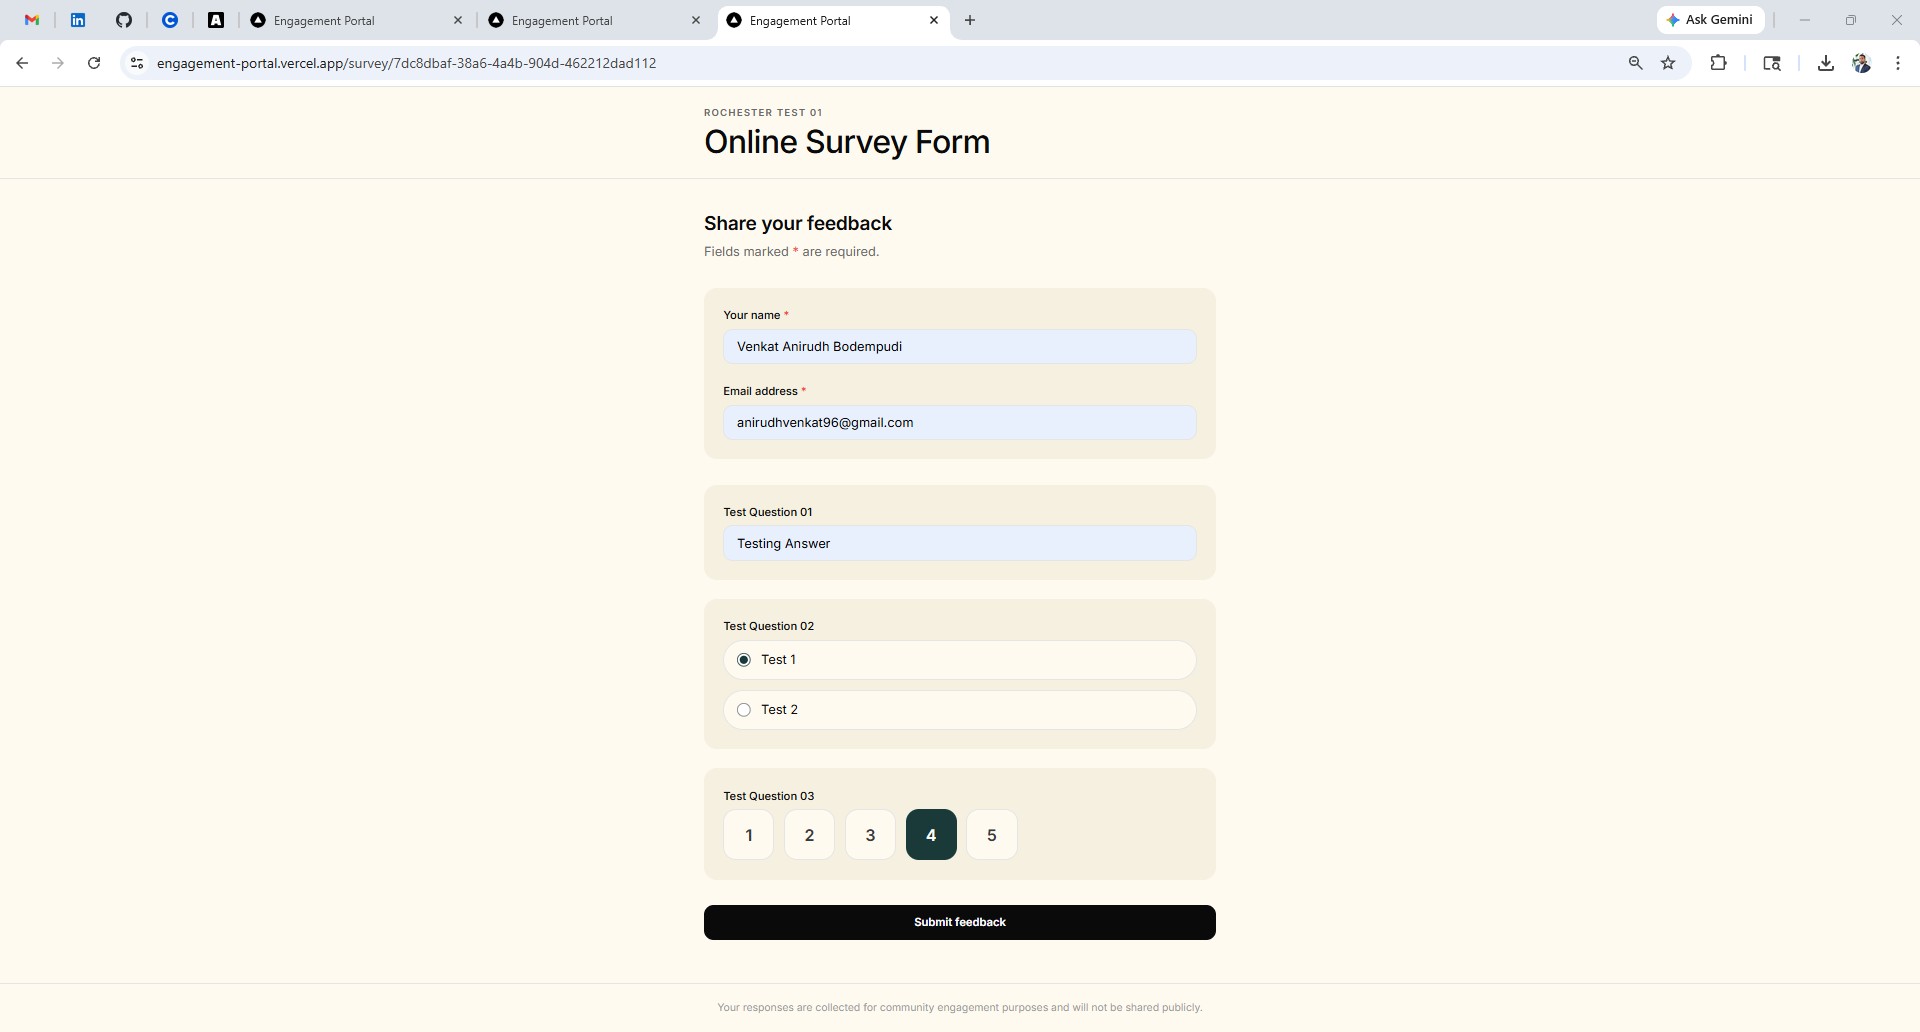
The planner builds a survey in the admin panel and shares a link with attendees. This survey can also be emailed to community members who could not attend in person. The public form supports short text, long text, multiple choice, and rating scale questions. Responses are stored per session and exportable as CSV.
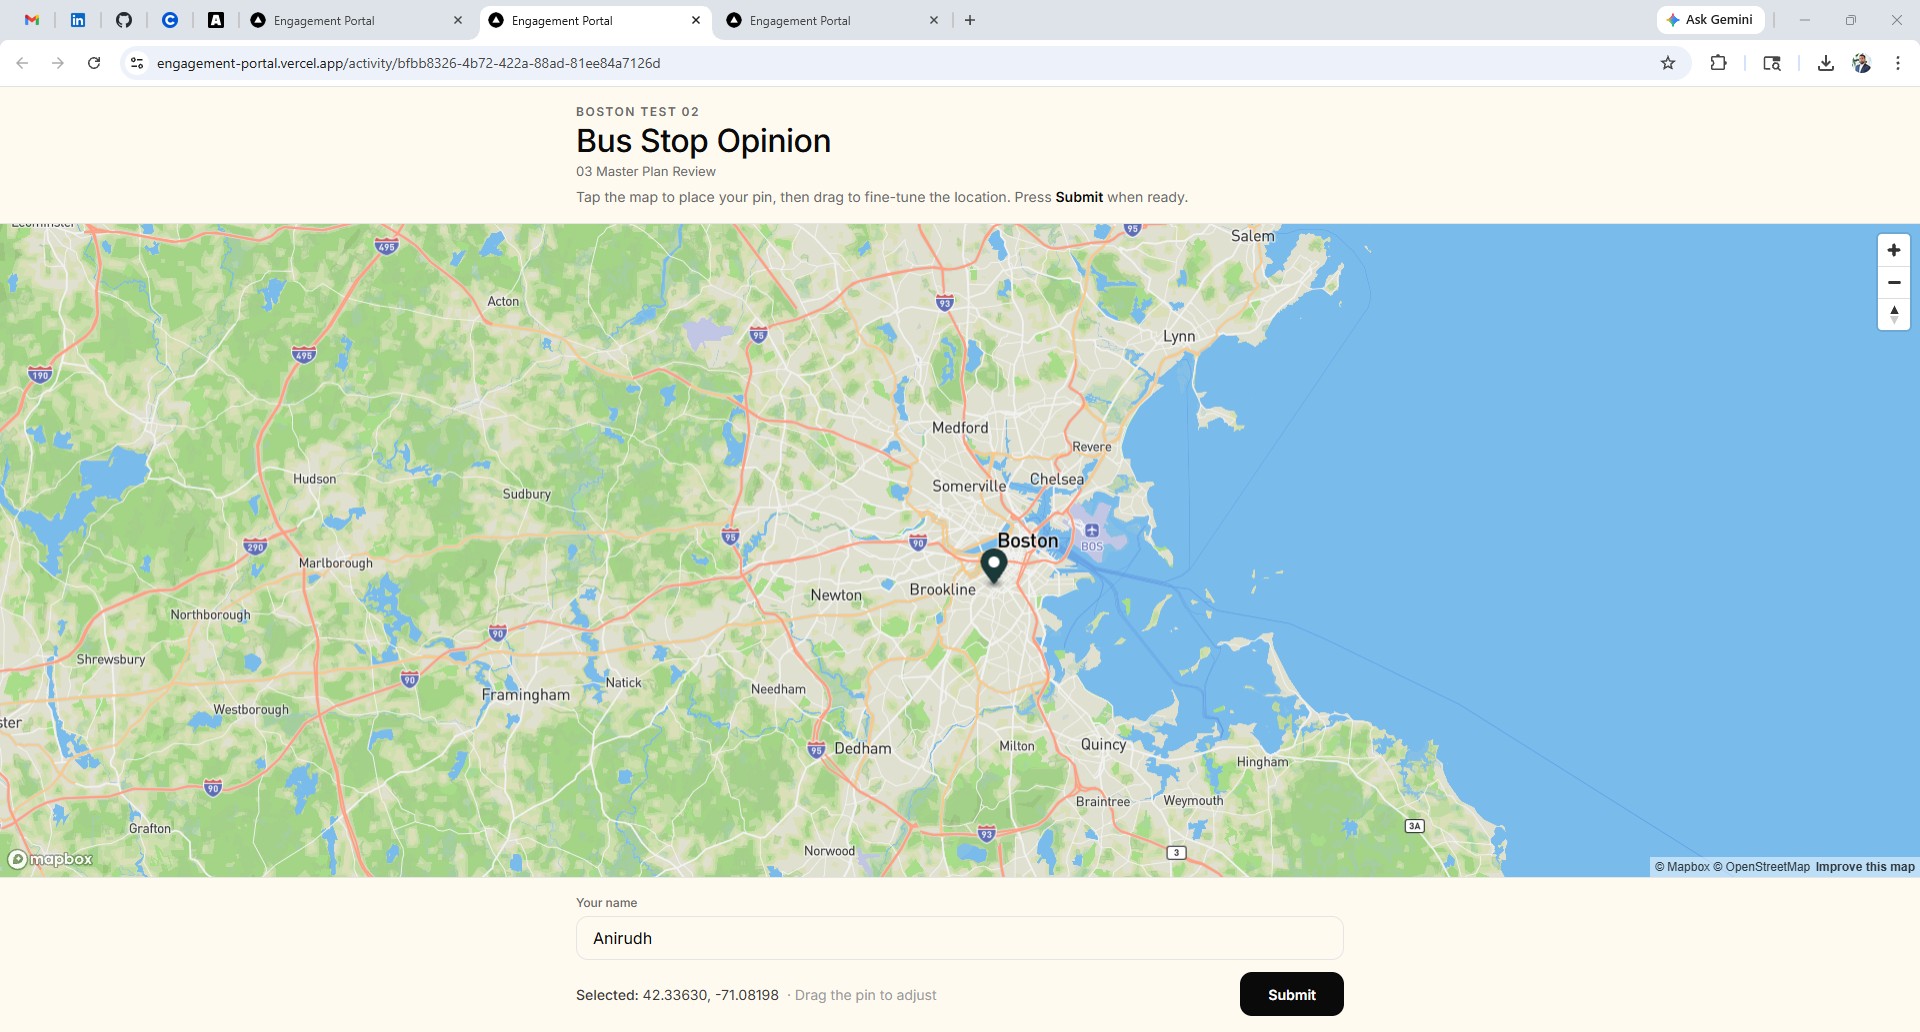
The most powerful feature of the portal is the activity interface which is a full-screen map where attendees tap to place a pin indicating a spatial preference. In this proof of concept, attendees mark where they would like to see a bus stop in their neighborhood. Every pin is saved with coordinates and linked to the attendee’s record.
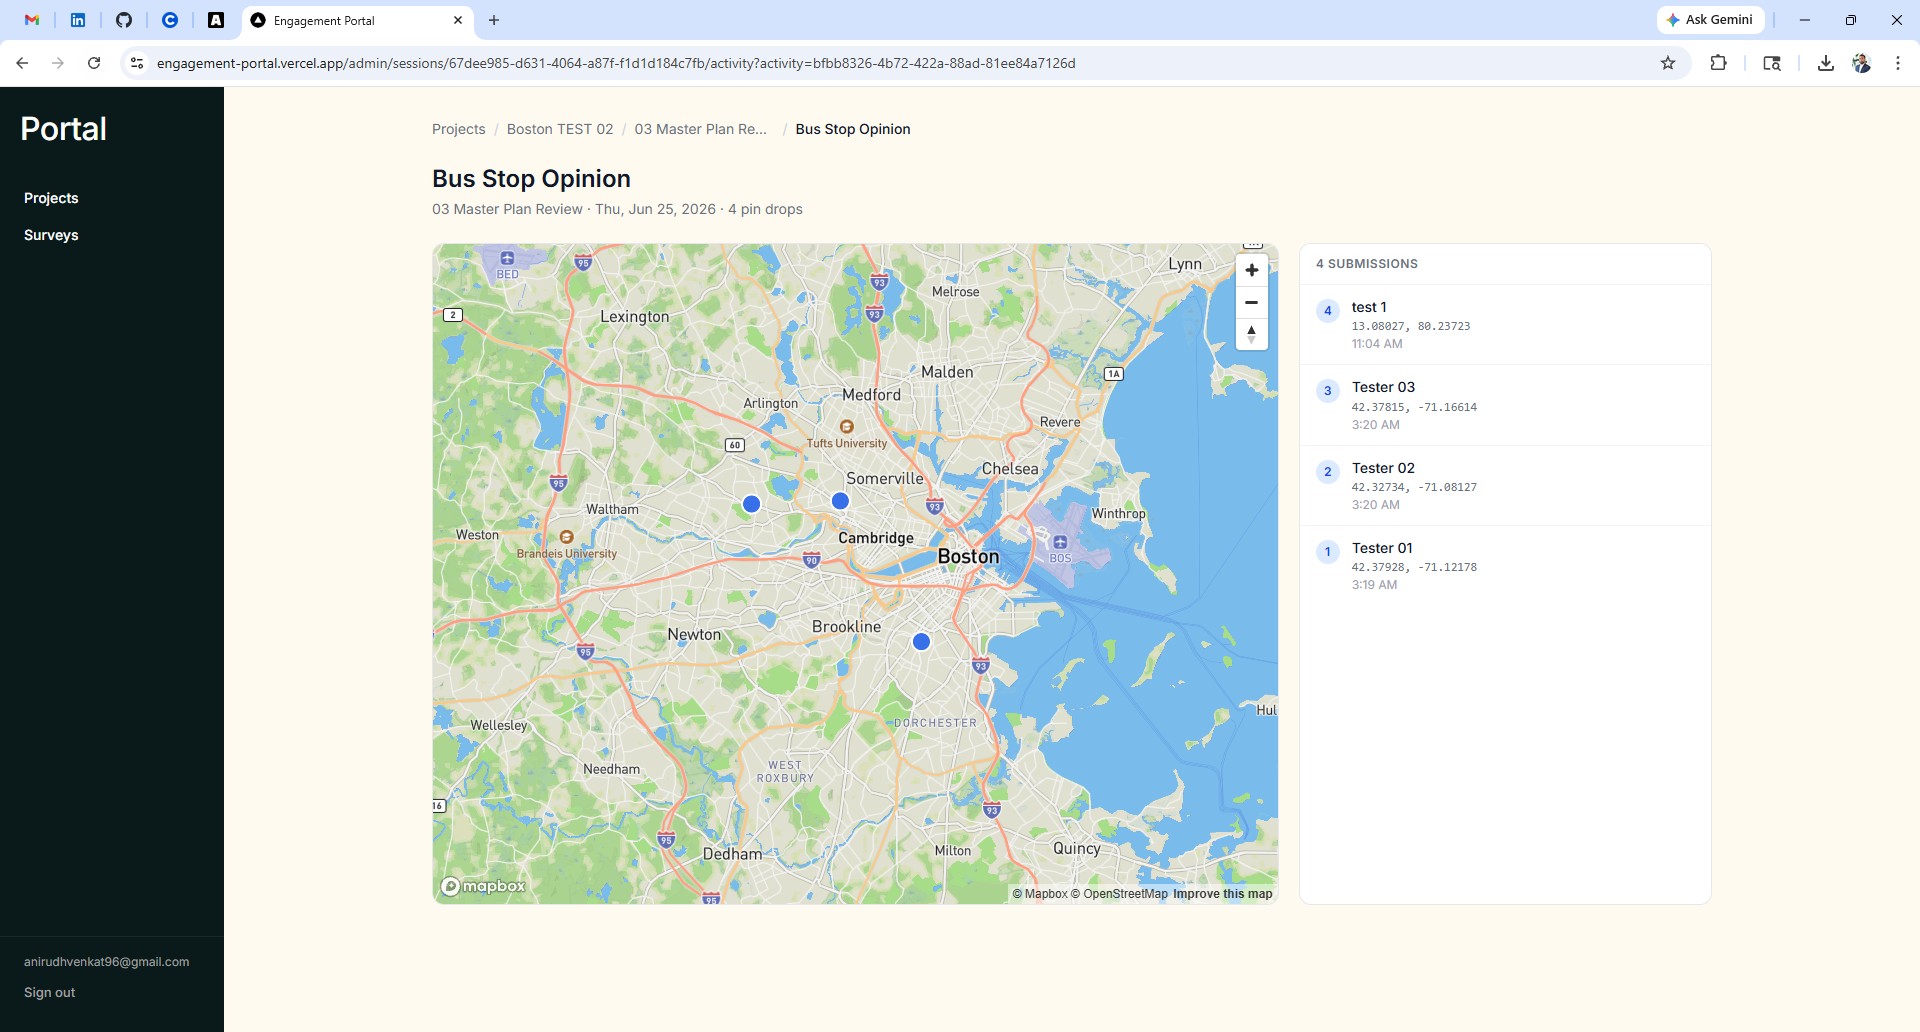
After the session, the planner opens the admin panel to find a complete record — attendee list, survey responses, and all map submissions visualized as clustered markers. Every dataset is exportable. Photos uploaded during the session are stored in a dedicated folder.
Session-scoped data model
Every piece of data — check-ins, survey responses, activity submissions — is linked to a session, which belongs to a project. This makes it possible to run multiple engagement sessions under the same project and compare data across them.
Plugin-based activity system
The activity interface is designed as a sandbox. The map pin-drop is the first activity type, but the architecture supports adding new types — polygon drawing, image ranking, drag-and-drop prioritization — without changing the core data model. Each activity type stores its output as structured JSON.
Stack